Introduction
Software
Applications
Detectors
GM-10
GM-45
GM-90
Accessories
Test Source
Battery Box
Coincidence Box
Anti-Coincidence
GMI Interface
Air Sampler
Download
Linux
Users Group
Interfacing
Raspberry Pi
Random Numbers
Safety Uses
Radiation Info
Specifications
FAQ
Articles
Experiments
Rad Map
Links
Secure Order
Detectors
Contact
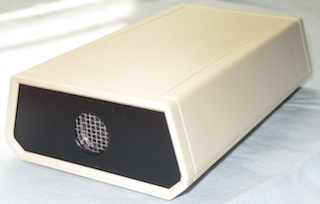
Using a GM-10 / GM-45 Geiger Counter Radiation Detector With a Raspberry Pi
Below I show how a GM-10 geiger counter radiation detector (available here) can be easily interfaced to it.

Information about the detectors is available here
Some detailed information about interfacing the detectors is also available.
The GM-10 has a RS-232 interface, which not only transmits the radiation reading (one byte per detected particle), but also powers the detector, via the handshake lines. A USB/serial adapter was used to connect the GM-10 to one of the USB ports on the Raspberry Pi.
If you'd like to buy a GM-10 or GM-45 geiger counter, here is the Online Order Page
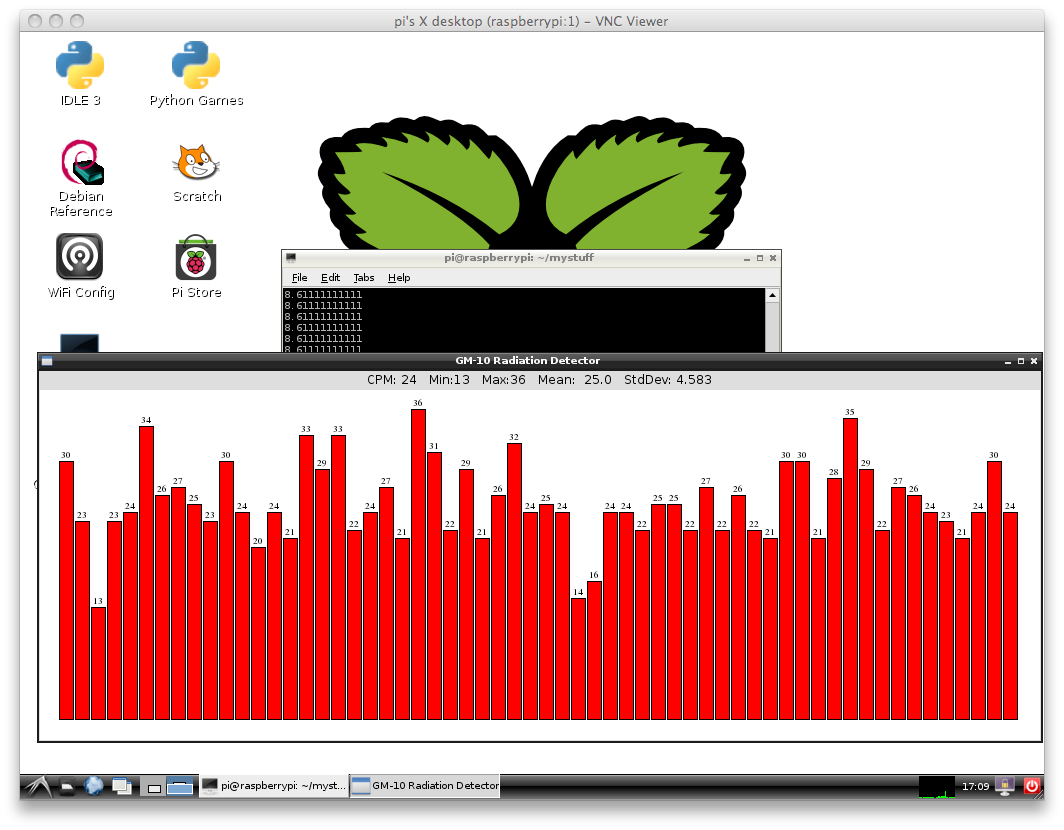
The following Python code reads the number of received bytes every second, and updates a graph once a minute with the Counts Per Minute (CPM), which is the number of radiation detection events per minute. Some statistics are also calculated: minimum, maximum, mean, and standard deviation. It also flashes an LED once per second, to show that it is alive and running.
#!/usr/bin/env python

import RPi.GPIO as GPIO, time, os
import serial
import math
import collections
d = collections.deque([0] * 60)  #keep track of the last 60 one second readings, init them to zeros

cpm=0  #one minute average = Counts Per Minute
secCounter=0   #used to count to 60 seconds

ledStatus=False  #used to toggle an LED

cpm_data = collections.deque()  #keeps track of an hours' worth of CPM values

DEBUG = 1
RED_LED = 23

GPIO.setmode(GPIO.BCM)
GPIO.setup(RED_LED, GPIO.OUT) #set up this GPIO as an output to flash an LED
# change this to match the serial port device you wish to use in your system
port = serial.Serial("/dev/serial/by-id/usb-FTDI_FT232R_USB_UART_A4008VgR-if00-port0", baudrate=38400, timeout=0.0,dsrdtr=True)
print port

from Tkinter import *
def stopProg(e):
    root.destroy()

def get_counts():
    global d
    global ledStatus  #toggles an LED on and off
    global cpm   #one minute average
    global secCounter

    GPIO.output(RED_LED, ledStatus)  #toggle the LED
    ledStatus = not ledStatus
    recbytes=port.read(100) #read some bytes from the serial port
    newCounts=len(recbytes) #number of bytes is the number of detection events
    cpm=cpm-d.popleft() #take the reading from 60 seconds ago out of the deque and subtract it from the one minute average
    cpm=cpm+newCounts  #add this reading to the one minute average
    d.append(len(recbytes)) #add this reading to the deque

    secCounter=secCounter+1
    if secCounter>=60:
        # now rotate in new CPM value, each minute
        if len(cpm_data)>=60:  #if we got 60 readings, we have a new minute's worth of data
            cpm_data.popleft()  #get rid of the oldest CPM reading
        cpm_data.append(cpm)  #add the new one
        secCounter=0
        draw_graph()  #update the graph

    root.after(1000, get_counts)  #do it again in a second

def draw_graph():
    global cpm
    global min_cpm
    global max_cpm

    y_number_space=20 # extra space to put the CPM above the bar
    y_mult = 1  #this will be computed later
    y_gap = 20  #some white space
    x_mult = 2  #white space between bars
    x_width = 14  #width of each bar
    x_gap = 20  #some white space
    c.delete(ALL)

    #variables for statistics
    s0=0
    s1=0
    s2=0
    min_cpm=999999
    max_cpm=0
    mean=0

    for x, y in enumerate(cpm_data):
        if y < min_cpm:
            min_cpm = y

        if y > max_cpm:
            max_cpm = y

        s0=s0+1
        s1=s1+y
        s2=s2+y*y
        mean=mean+y

    #compute mean, calculate y multiplier so we fit all the bars on the graph
    if s0>0:
        mean=mean/s0
        y_mult=(float(c_height-y_gap-y_number_space)) / float(max_cpm)
    else:
        mean=0
        min_cpm=0

    #compute standard deviation
    if s0>1:
        std_dev = math.sqrt((s0 * s2 - s1 * s1)/(s0 * (s0 - 1)))
    else:
        std_dev = 0

    #draw the bars
    for x, y in enumerate(cpm_data):
        x0 = x * x_mult + x * x_width + x_gap
        y0 = c_height - (y * y_mult + y_gap)
        x1 = x * x_mult + x * x_width + x_width + x_gap
        y1 = c_height - y_gap
        # draw a bar
        c.create_rectangle(x0, y0, x1, y1, fill="red")
        # put the y value above each bar
        c.create_text(x0+2, y0, anchor=SW, text=str(y), font=("Times",9))

    #update the statistics display
    selection = "CPM: %d   Min:%d   Max:%d   Mean:%6.1f   StdDev:%6.3f" % (cpm,min_cpm,max_cpm,mean,std_dev)
    label1.config(text = selection)


root=Tk()

label1=Label(root,text="CPM:")
label1.pack()
root.minsize(1000,370)
root.title("GM-10 Radiation Detector")

#set up a canvas
c_width = 1000
c_height = 350
c = Canvas(root, width=c_width, height=c_height, bg= 'white')
c.pack()

draw_graph()

#collect the first second's worth of readings
root.after(1000, get_counts)
root.mainloop()
Want a GM-10 or GM-45 radiation detector to interface to your Raspberry Pi?